Stewardship
Consider the full impact of energy infrastructure on land, water, and future generations.

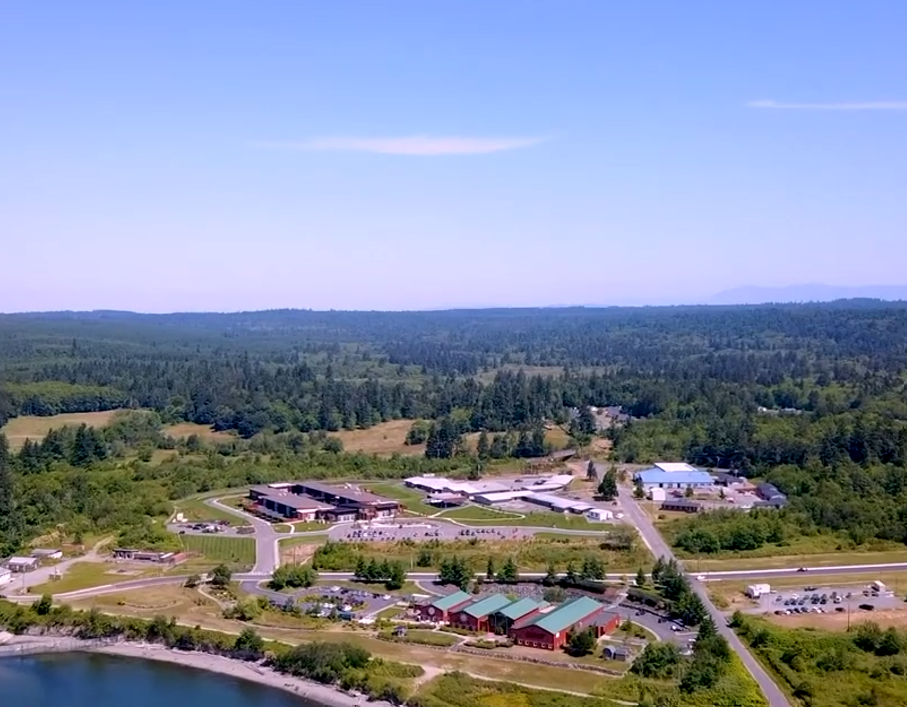
KINETICCORE × TULALIP · ENERGY FOR GENERATIONS
Cleaner power. Greater independence.
A future shaped by the communities it serves.
The future of energy should strengthen a community’s ability to care for its people, its land, and what comes next.
For Tribal Nations exploring their energy future, KineticCore offers a conversation about a different way to store power—one built around kinetic motion rather than chemical reactions.
Every Nation has its own priorities. Our starting point is to listen, then explore where our technology can support a community-defined plan.


A FUTURE WORTH CARING FOR
The people.
The places.
The generations to come.
Consider the full impact of energy infrastructure on land, water, and future generations.
Explore how locally planned storage can support greater control over energy systems.
Evaluate long-life infrastructure around the needs and economics of the community.
The choices we make about storing and delivering power have consequences far beyond the equipment itself.
AN ALTERNATIVE TO CHEMICAL STORAGE
MaterialsMineral extraction and processing can carry significant environmental impacts.
SafetyLithium-ion systems require measures to manage thermal runaway and fire risk.
End of lifeResponsible collection, recycling, and disposal matter for land and water.
AN ALTERNATIVE TO FUEL-BASED POWER SUPPORT
Recurring costsFuel delivery, operation, and maintenance add ongoing expense.
Air qualityDiesel combustion produces exhaust and carbon emissions.
Community impactNoise and equipment siting can affect the surrounding environment.
Storage supplies previously stored energy. It does not generate power or replace a generator’s runtime in every application.
For Tulalip, the next step is to connect community priorities with a specific project: a proposed clinic pilot, a wider deployment opportunity, and the technology and economics that support the case.
The first planned pilot combines a clinic heat pump and HVAC update with EV fast charging, without a transformer upgrade. Potential Washington grant support could help bring the project forward.
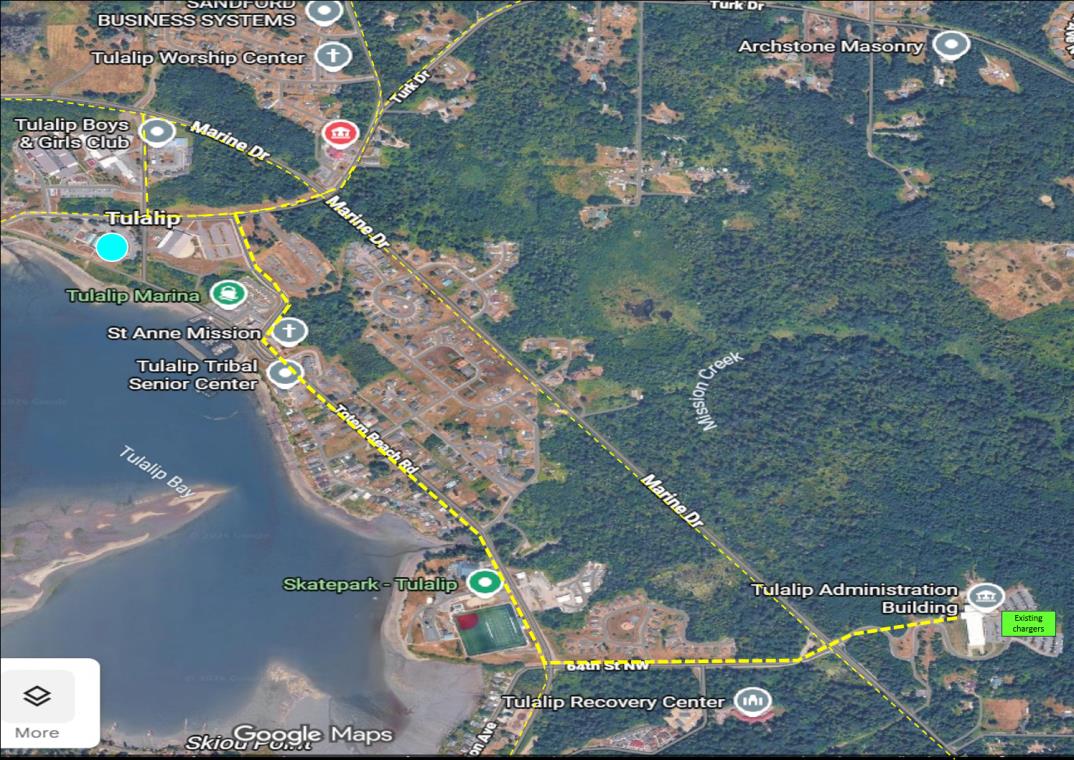
Planned pilot area · Aerial imagery supplied in the October 28 presentation.
Additional funds are sought to reduce development risk and expand pilot production operations. Pilot reductions are proposed targets, not measured results.
Potential Tribal investment in KineticCore, from bridging grant work to supporting the clinic pilot and an initial production facility.
Provide bridging investment so grant work can begin immediately after the December 2026 announcement.
Support the Tulalip Clinic Pilot without the Washington State RD&D grant, participating as a supporting investor.
Support KineticCore as lead investor, incorporating the Tulalip Clinic Pilot and the initial production facility.
Proposed investment & deployment timeline
Potential investment paths and proposed timing from slide 4 of the October 28, 2026 Tulalip subdeck. Timeline spacing is schematic. Grant award and investment remain subject to confirmation.
An opportunity to connect energy storage development with Tribal priorities for emissions reduction, resilience, and electrification.
Potential kinetic battery deployments
across 11 Tribal locations.
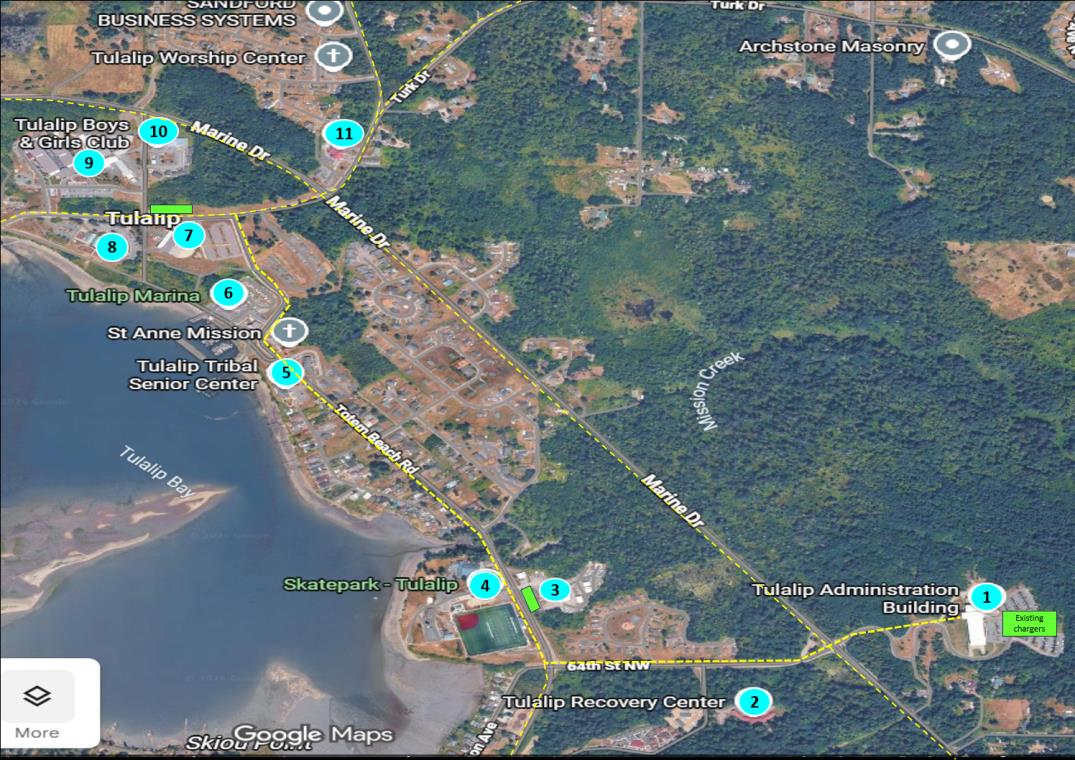
Potential deployment locations from the supplied proposal; locations and scope remain subject to project development.

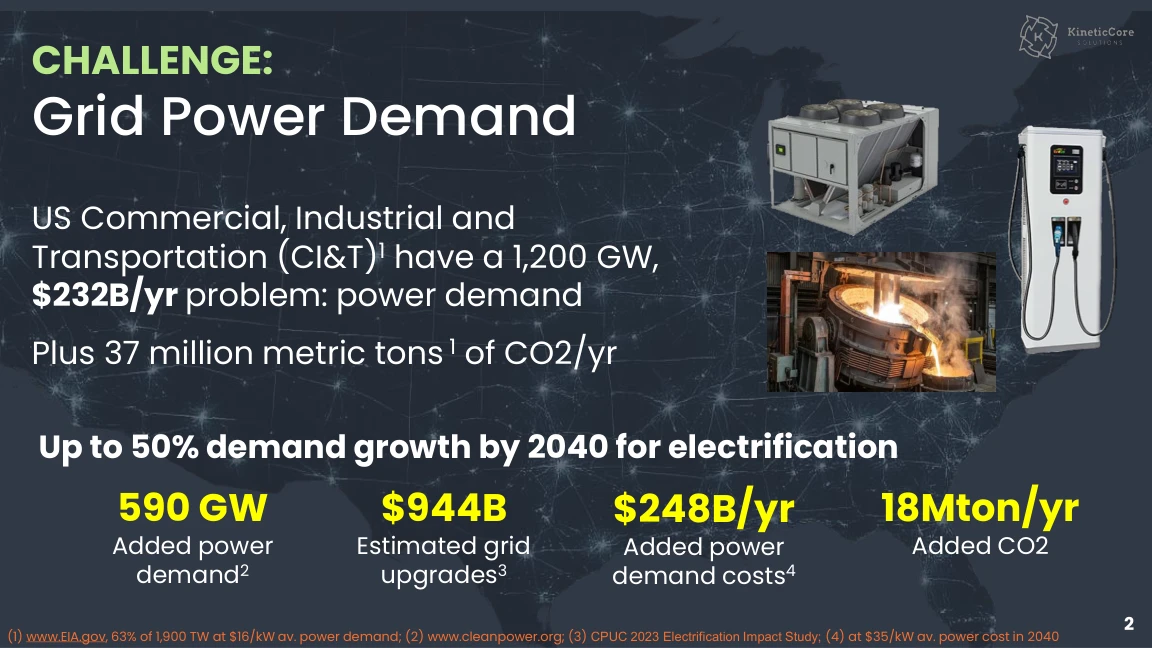
Up to 50% demand growth by 2040 adds pressure to infrastructure, operating costs, and emissions.
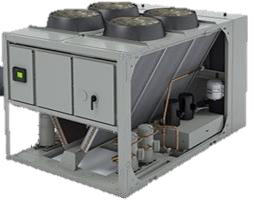
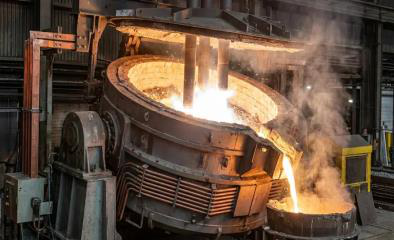
2040 scenario from slide 2. Sources cited in the deck: EIA, American Clean Power and the CPUC 2023 Electrification Impact Study; future costs assume $35/kW average demand pricing. Current emissions are reported as 37 million metric tons/year.
Behind-the-meter kinetic batteries support periodic, high-power loads. The grid provides part of the power; the battery helps supply the peak.
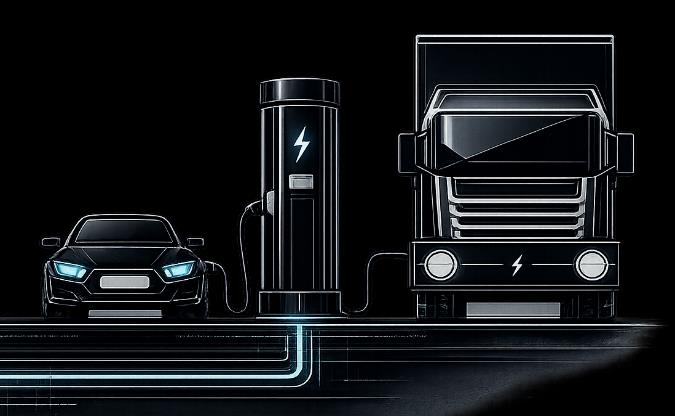

The deck describes peak power shaving of up to 80% and multiple operating cycles per day.
Potential power cost reductions of up to $110,000 per year, depending on the load profile and electricity tariff.
Reduce the need for grid power upgrades and the emissions associated with peak power generation.
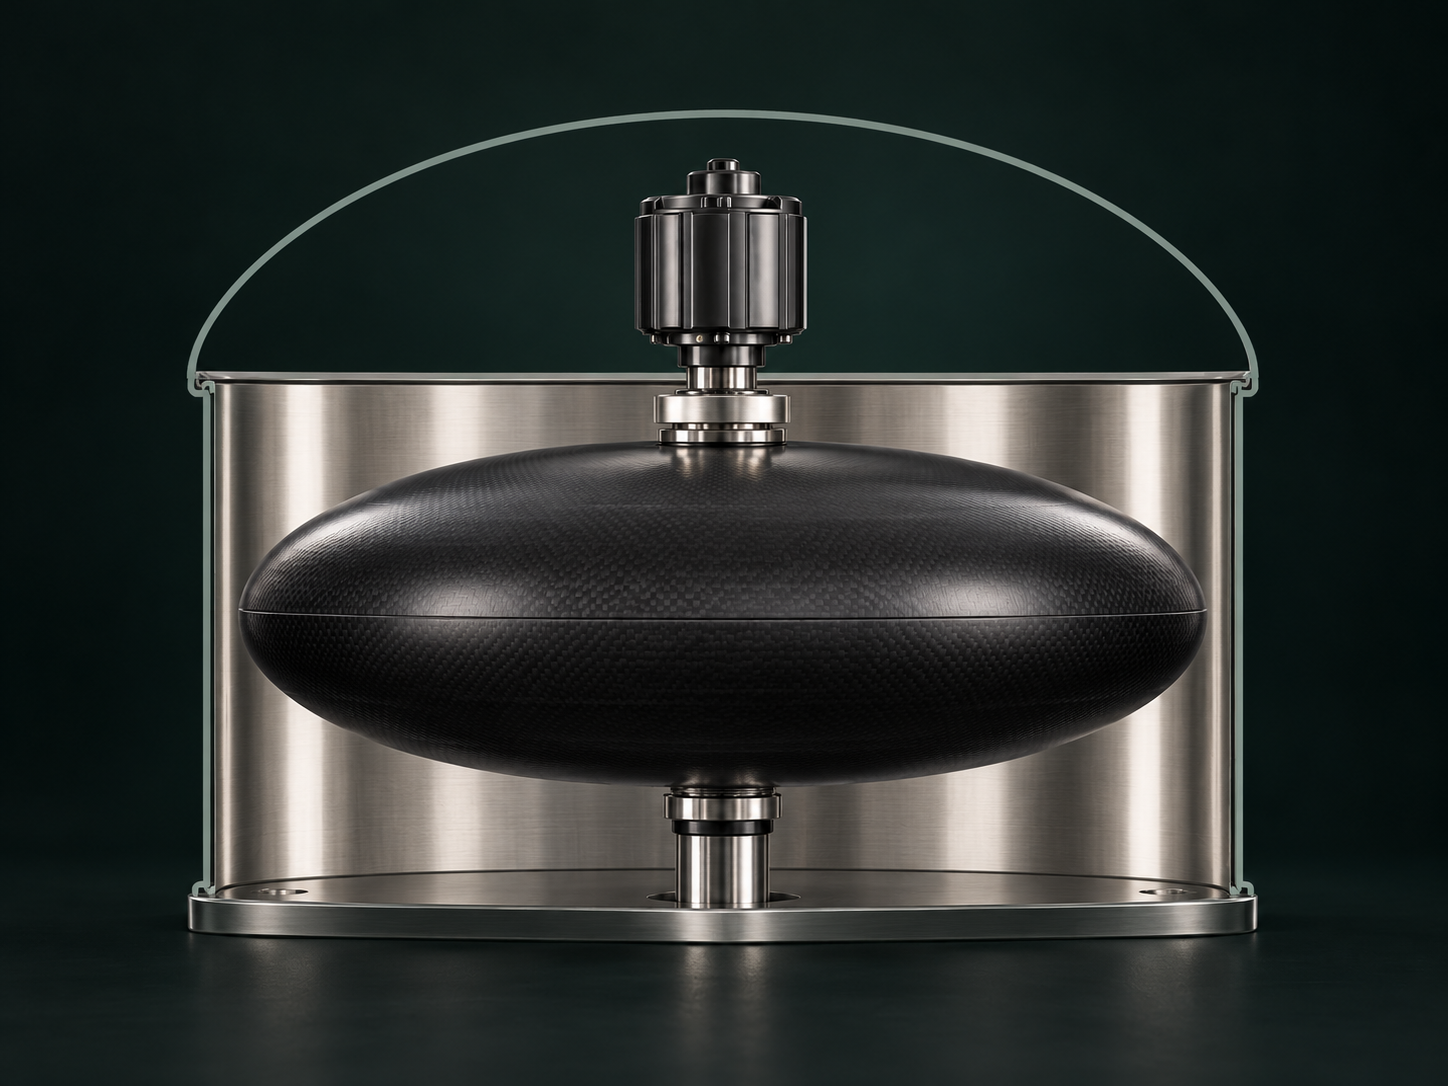
2027 development target

2027–2028 development target
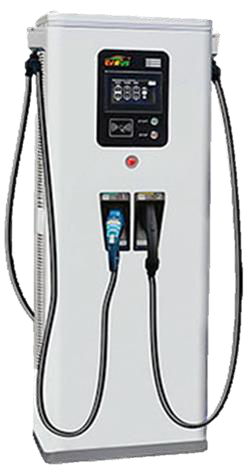
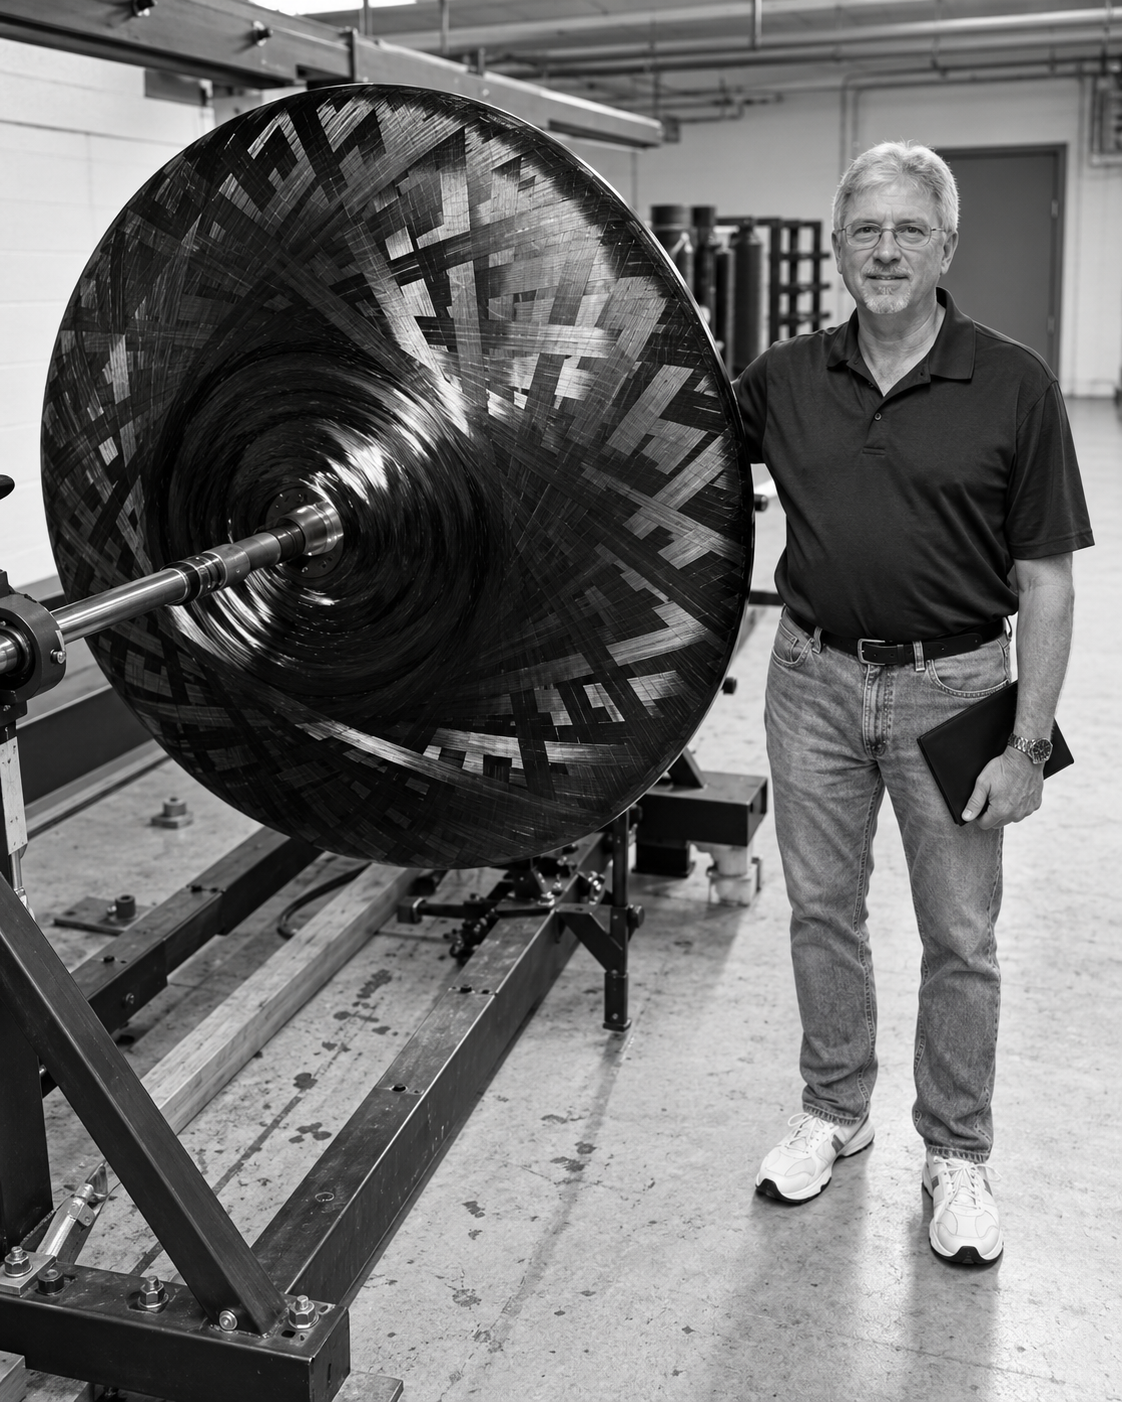
High-resolution AI recreations based on the deck’s prototype photo and product concepts. Equipment details and the person’s appearance are reconstructed; consult the original supporting slides for source photographs and technical references.
A non-chemical approach to high-power storage. The TRL-5 prototype is complete, with TRL-6 development and TRL-7 pilots planned for 2027–2028.
*Company-reported design and cost claims from the deck. Cost comparison applies to the high-power duty cycle modeled there. Product visuals are AI-recreated development concepts.
Repeated high-power use changes the economics of storage. The deck compares initial capital cost with the replacement costs accumulated over ten years.
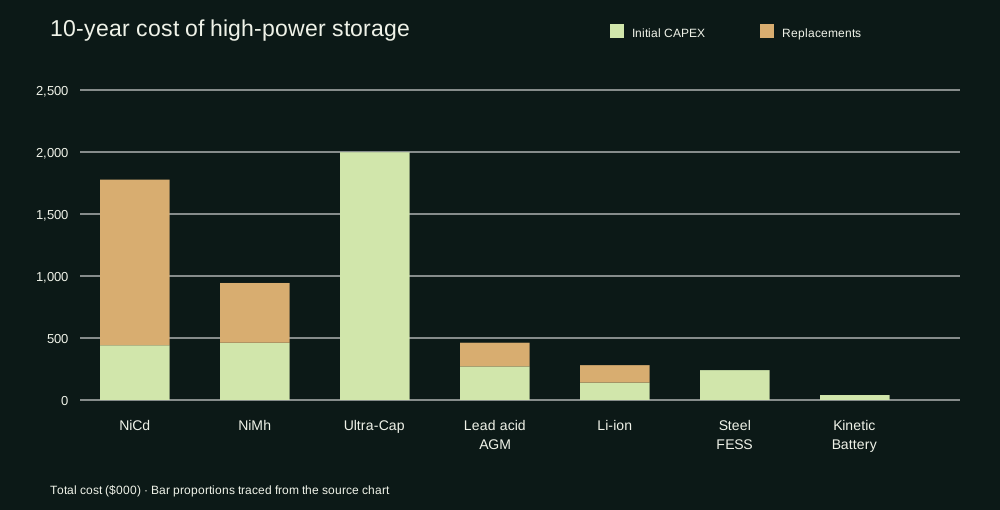
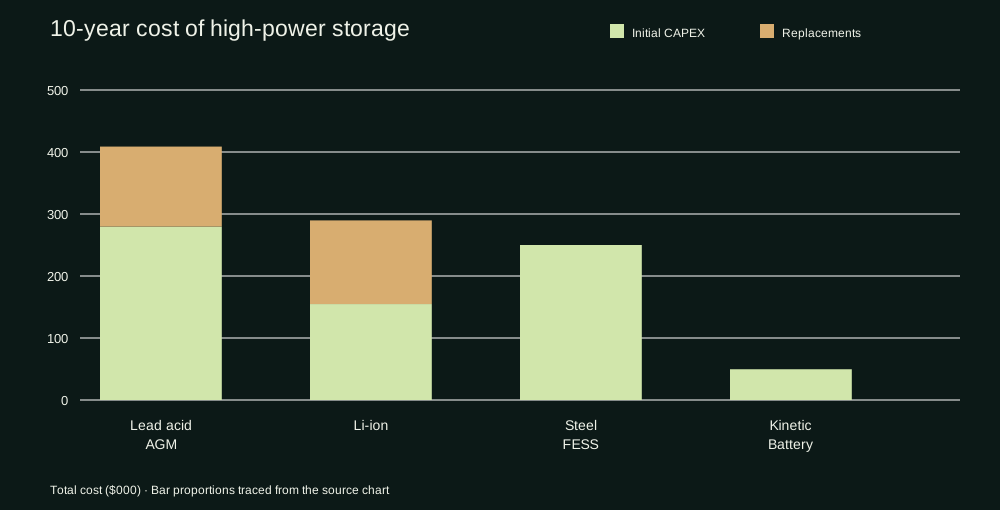
Some technologies require repeated replacements under the modeled duty cycle.
Steel flywheel storage avoids some replacements but starts with a larger investment.
The company model positions the kinetic battery as the lowest-cost option in this comparison.
Scalable redraws of slide 4; bar proportions traced from the source images, rather than reconstructed raw inputs. Model: 250 kW boost, $20/kW demand pricing, 15 partial cycles/day at 25 kWh each; replacement CAPEX assumed at 65% of initial CAPEX. The deck states $75k/year savings for this model. “No ROI” means no payback before replacement or within ten years. See the source slide for its assumptions; the separate on-page calculator uses an explicit monthly demand-charge calculation.
The presentation compares two approaches to 50 kWh of storage: a heavy steel cylinder and KineticCore’s lightweight flywheel.
| 50 kWh comparison | Steel cylindrical flywheel | KineticCore flywheel |
|---|---|---|
| Mass | 6,000 kg | 330 kg |
| Dimensions shown | 1.0 m × 1.0 m | 1.6 m × 0.5 m |
| Tip speed | 370–430 m/s | 1,400–1,620 m/s |
| Energy density | 8 Wh/kg | 150 Wh/kg |
| Cost per kWh | $1,000–$1,600 | $190–$230 |
Company comparison from slide 23. The slide characterizes the design as 95% lighter and 450% faster, with improved safety; it cites the 1994 ORNL “Flywheel testing and evaluation” report for its failure-mode claim. These are supplied technical claims, with pilot testing and certification still on the roadmap.
Illustrative lifetime impacts for a kinetic battery shaving 250 kW of peak power, as modeled in the presentation.
Power cost savings over 25 years
Grid access upgrade savings
Maintenance savings
Deferred grid upgrades
Regulation benefit in the deck model
CO₂ production avoided
Mined rare earth and mineral ores avoided
Li-ion battery resources displaced
Non-recyclable Li-ion hazardous waste avoided
Deck model: 250 kW peak shaving, 4 hours/day over 25 years; $400/kW grid upgrade cost; $20/kW demand rate; 375 kg CO₂/MWh; 400 kWh, 0.6C Li-ion comparison with a 6.5-year life. These figures describe a modeled scenario and are not Tulalip pilot results.
Illustrative annual demand-charge savings
250 kW × selected monthly rate × 12 months
This simple illustration assumes the full 250 kW reduction lowers billed demand every month. It excludes equipment, installation, charging energy, service costs, and tariff-specific rules; it is not a project ROI estimate.
If 10% of 6.5 million U.S. commercial, industrial and transportation sites shaved 250 kW by 2040, the company model projects:
Scenario from slide 7, distinct from the current 2026 TAM estimate. Market calculation assumes an average of two kinetic batteries per DC deployment and a 30% federal tax credit. These are projected adoption impacts, not installed results.








Organizations shown in the deck’s grants/prizes and accelerator sections.
Four pilots planned: Washington, Maryland, California and Colorado.
| Direct revenue | $503M |
| Recurring revenue | $87M |
| License revenue | $95M |
| Total | $685M |
Requested units and revenue opportunity are reported in slide 11; they are not recognized revenue or firm purchase orders. NDA/LOI/MOU counts are distinct from contracted sales. Organization logos identify the programs shown in the deck, not a new endorsement claim.
Prototype validation comes first. Pilot builds, field deployment, and certification create the foundation for production.
TRL-5 achieved. Six developmental prototypes built; pilot design underway.
TRL-6 target. Contract manufacturing for four pilot units.
TRL-7 target. Deployment and UL certification; in-house batch of approximately 12 units.
TRL-8 target. Prototype manufacturing line targeting 144 units.
480 units in 2030; 1,200-unit semi-automated line and TRL-9 target in 2031.
Funding history shown on the timeline: $150k founders, $1.43M pre-seed, $536k grants.
NLR fellowship shown in the development funding path.
Seed funding, grants and pilot activity support development and certification.
Production expansion and licensing.
Slide 16 uses historical funding figures that differ from the traction slide. They are shown here with their original context rather than combined.
Development and manufacturing milestones are planned targets from the October 2026 deck, subject to funding, testing, and certification.
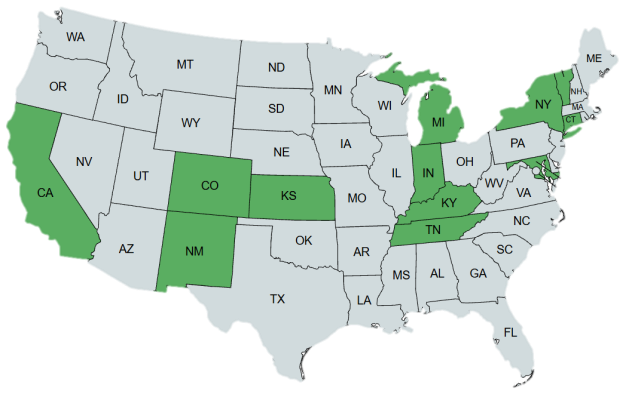
The deck estimates a 1,200 GW, $232B/year power demand challenge across U.S. commercial, industrial, and transportation facilities, with up to 50% demand growth by 2040.

Demand-rate map from the supplied presentation.
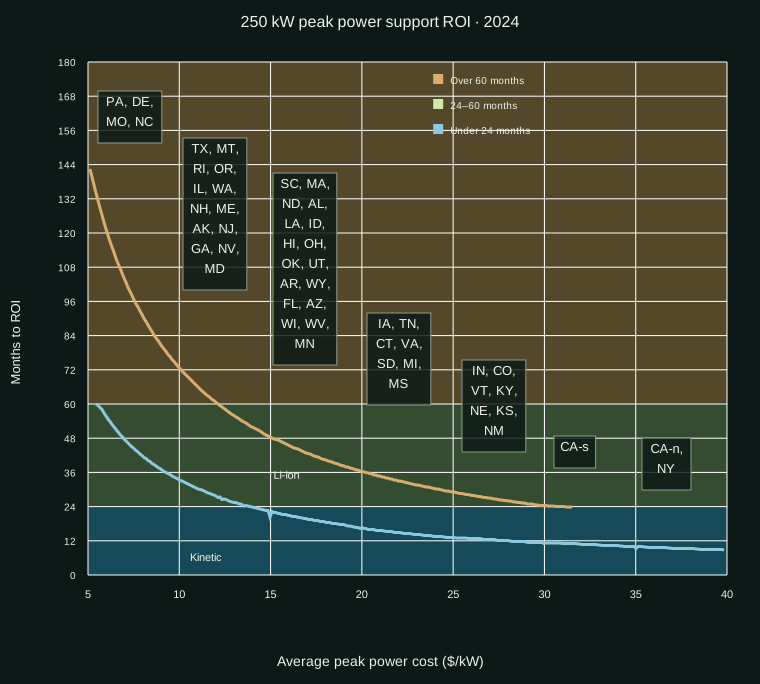
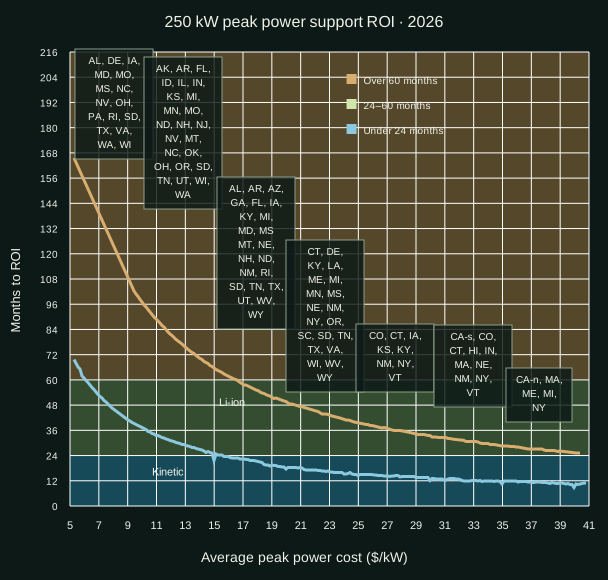
Scalable redraws of slide 10; ROI curves traced from the original images, not recalculated from an underlying model. The deck reports TAM growth of over 35% in two years; the displayed $42B and $65B figures are retained as provided. Chart colors distinguish payback ranges and are preserved for readability.
Entrepreneur programs, customer discovery, and funded pilots establish the initial market.
Utilities, EV charging networks, OEMs and EPC partners create routes to market.
Manufacturing partners, supply chains, and logistics support regional and international deployment.
Deck adoption scenario: 10% of 6.5 million U.S. CI&T sites shaving 250 kW by 2040 equates to 163 GW reduced demand, $260B deferred grid upgrades, $68.5B/year reduced power costs and 5 million tons/year reduced CO₂. The deck separately cites a $70B+ addressable deployment market under this scenario. These are projections with different assumptions from the 2026 TAM estimate.
$25M pre-money valuation · $250k–$2M individual investments · AHG-Energy listed as lead.
Team expansion, pilot programs and UL certification, and the first production facility.
The deck reports $7M in soft commitments for 28 pilot units and a planned 2.5-year runway.
B2B hardware, recurring monitoring and service, per-unit licensing royalties, and Power-as-a-Service leasing.
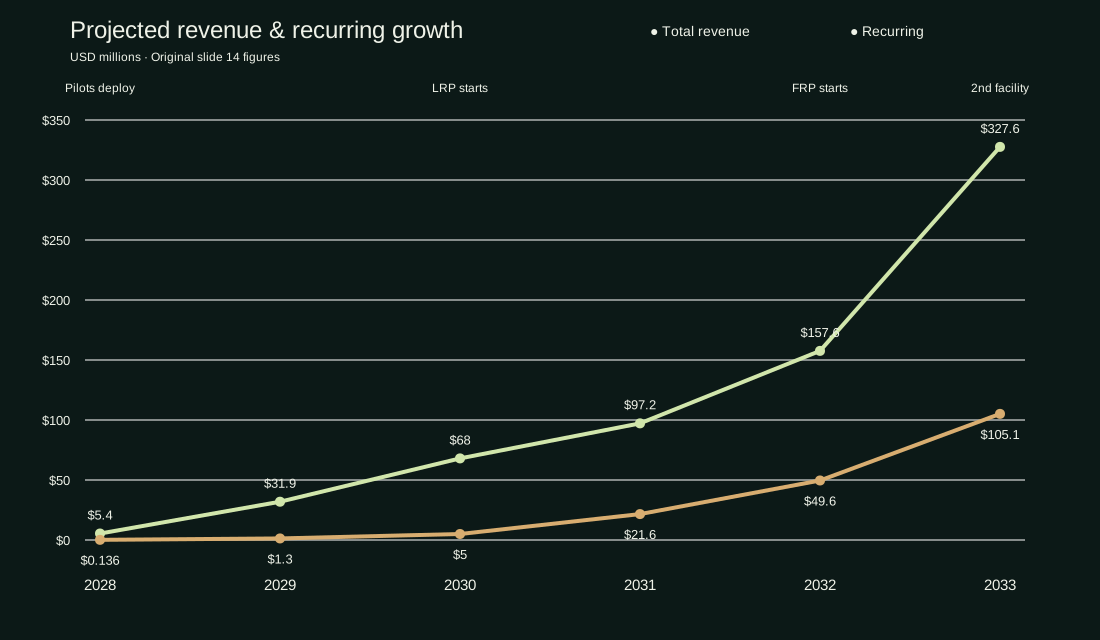
The deck also outlines self-funding after Series A, an acquisition exit target, Opportunity Zone and IRS Section 1202 qualification claims. Eligibility depends on the relevant investment and entity requirements.
| Metric | 2028 | 2029 | 2030 | 2031 | 2032 | 2033 |
|---|---|---|---|---|---|---|
| Units sold | 16 | 204 | 840 | 1,260 | 2,160 | 4,320 |
| Hardware revenue | $4M | $30.6M | $63M | $75M | $108M | $222M |
| Services / licensing | $136k | $1.3M | $5M | $20M | $49M | $105M |
| COGS | $3.7M | $21M | $45M | $62M | $94M | $183M |
| EBITDA | $0.8M | $7.5M | $12M | $16M | $38M | $104M |
| Net income | $0.7M | $7.1M | $11.8M | $16.1M | $39.4M | $105M |
| Total revenue (reported) | $5.4M | $32M | $68M | $97M | $157M | $327M |
Figures are reproduced from the company pro forma. Reported total revenue does not equal the displayed hardware and services/licensing components in every year; totals are retained as provided. Financial projections are forward-looking, dependent on production, sales and funding assumptions, and do not represent guaranteed results.
Illustrative seven-year seed investor return in the deck.
Illustrative seven-year multiple on invested capital.
Illustrative net present value at a 25% discount rate.
Slide 22 assumes first-facility output is sold with a waiting list through 2033, bottom-up labor COGS and 10% distributions. It models a $4M seed for approximately 15% equity and under-five-year ROI (2030). Return projections are company scenarios based on first-facility capacity, LOIs/MOUs, modeled labor and material costs, and recurring revenue. LOIs/MOUs and soft commitments are not recognized revenue. See the original presentation for the full model and expansion scenario.
U.S. production and pilots, B2B hardware sales, monitoring and service, per-unit licensing royalties, and Power-as-a-Service battery leasing.
Licensed manufacturing and three to four additional facilities. Direct sales target regions with higher power costs; distributors operate within segment and regional limits.
U.S. manufacturing and market partners, then international expansion supported by multi-country IP protection. Target regions: UK, EU, Middle East, India and China.


Strategic targets and relationships shown in the supplied deck; inclusion of a logo does not imply a signed supply or customer agreement.
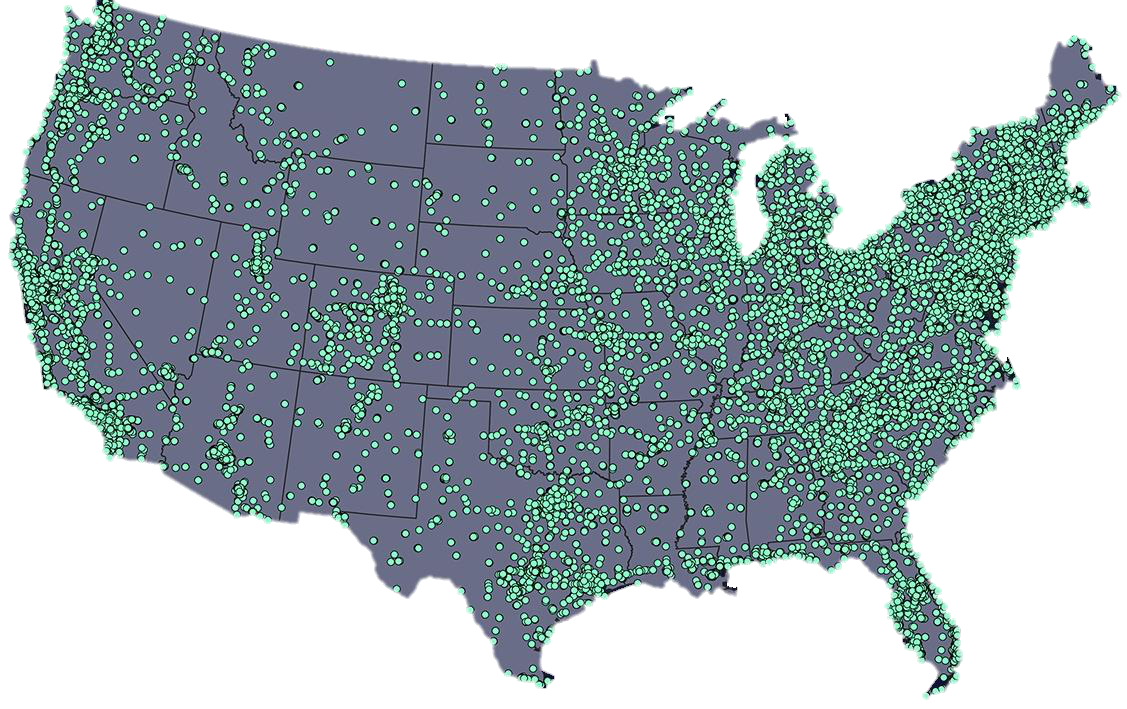
Long-term option-to-scale scenario from slide 21; the deck also reports 340 million tons of CO₂ pollution reduction and a ten-year Opportunity Zone exit point. This multi-facility scenario is distinct from the first-facility 2033 pro forma and depends on capital, manufacturing capacity and market adoption.

BS and MS Aerospace Engineering; PhD Industrial Engineering. 22 years as a USAF officer, engineer and test director, with 14 years in flywheel design and battery analysis.

41 years in construction and electrification; C-level leadership and four exited startups.

32 years in business development and marketing, business growth and fundraising.

34 years in systems design, data and system analysis.
30 years · Power systems manufacturing
President, Advanced Energy, retired
54 years · Composites manufacturing
President, Lawrie Technology Inc.
12 years · EV charger integration & controls
Lightning eMotors Engineering Director
37 years · Energy innovation
Executive Director, CSU Energy Institute
12 years · EV & infrastructure
Group lead, NLR Transportation and Mobility
12 years · EV builds & charger integration
President, KiloWatts EV charging
Advisory expertise spans power systems manufacturing, composites, energy innovation, EV infrastructure and charger integration. Full advisor and patent details are included in the source presentation.
Company-reported IP status from slide 24. Listed patent/application identifiers, territories and dates are available in the original slide below; no independent legal-status verification is implied.
Review the original charts, technical figures, assumptions and IP details at presentation scale.
Original slides retain the source presentation’s visual style and wording. All figures are dated company claims or projections. Download the full source presentation ↗